You may also be interested in...
Banner Tables - Advanced Reporting Display Options
Banner tables allow you to visualize and view your data relative to a single question. For example, if in your survey, one of the questions is "Where are you from?" - The answer options are:
North-West
West Coast
Mountain States
Mid-West
South
East Coast
North-East
Banner tables can allow you to visualize how respondents from each of these criterias responded to all the questions without having to create groups and segments for each option. This question that you segment the rest of the survey is called the Pivot Question.Goto
Step 1:
Choose the Pivot question. This is the question that you want to segment on. In the example above, this would be the question : "Where are you from?" Optionally, you can also choose a Sub-Pivot question. This will further subsegment the data based on a combination of the responses to both the questions.
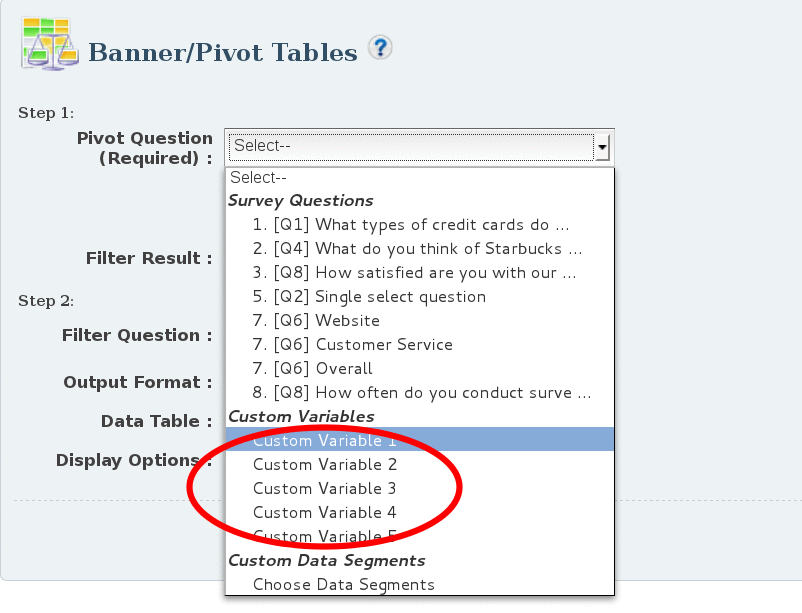
If you choose one of the Custom Variables, then a banner table will be produced for each distinct item for that custom variable. For example, if you are capturing sales region as one of the custom variables, choosing that custom variable will automatically segment your data based on every distinct region in your dataset.
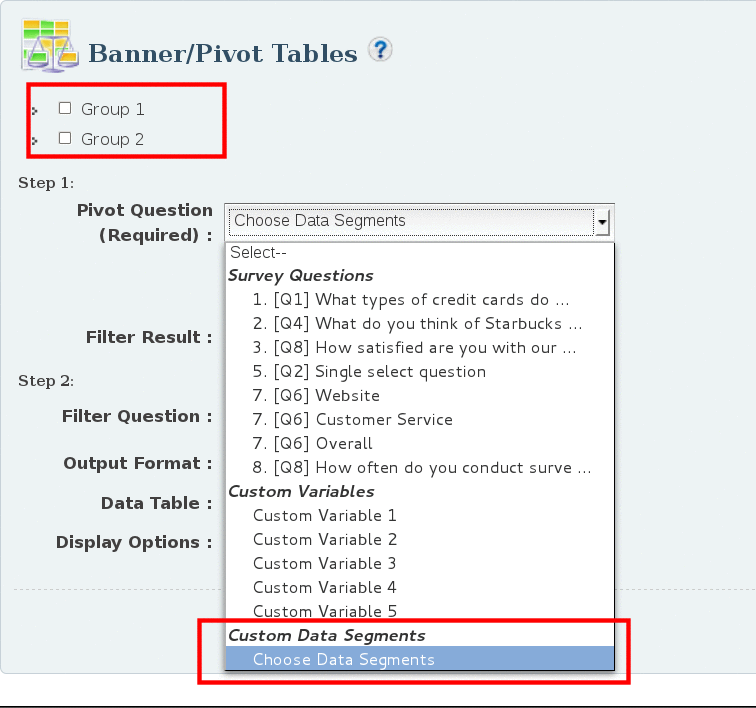
If you choose Custom Data Segment, you then need to provide the data-segements (Groups) that you want the banner table for. For an explanation on how to create customized data segments, please refer to the Grouping/Segmentation Tool.
3. Screenshot
Step 2:
Next choose the charting/output options
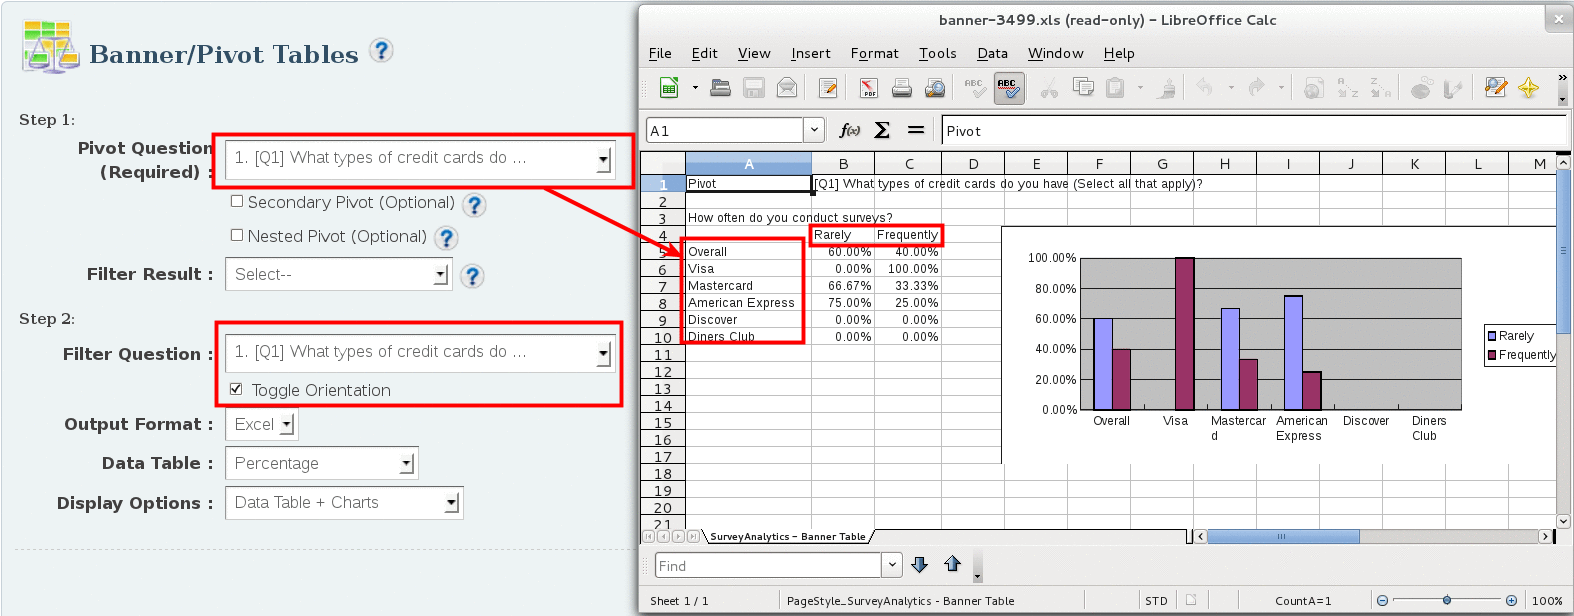
Filter Question
Filter Question can be selected when you want to generate Banner Table for single question. If Filter Question is selected the Banner Table is generated between this question and the Pivot question selected in step 1. Toggle Orientation: If Filter Question is selected you can choose to change the orientation of the Banner Table.
4. Screenshot
Excel
In the future we envision other formats like MS PowerPoint, PDF, HTML etc. As of now, Banner Tables are available in Excel format only.
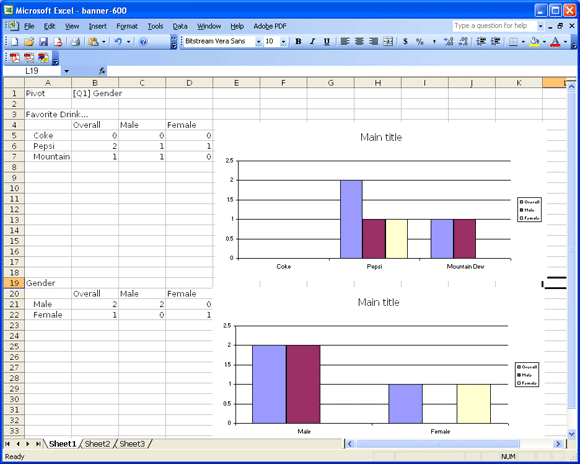
Data Table
The values produced in the Data Table can either be absolute frequency numbers i.e. the actual number of users who chose a particular option, or be relative percentage.
Display Options
The Banner Tables can be generated with or without associated charts. Generating Banner Tables without charts is generally faster and the resulting file is smaller also.
2. Screenshot
Yes. Choose the Custom Variable you want to segment on (in step 1) and the system will automatically create a banner table for every available data point.
1. Screenshot
Yes. Please see Advanced Reporting Display Options below.
As of now - No. This will be added in a future release.
Yes. Choose the first question as your primary pivot, and then choose your second question as the nested pivot. If you are using nested banner tables, please see the note on limitations below.
For simple (non-nested) tabs, there is no limit. Please keep in mind however that if your data-set is large or there are a lot of data-points (questions) in your survey, it may take a longer time for the system to generate out the banner table.
For Nested Pivot Tables, there is a limit of a total of 64 columns. This is there to prevent our system from being overutilized and degrading the service for others. This is a system limitation and no exceptions will be made.
Nested Pivot tables can only be used with Survey Questions and not with Custom Variables.
Banner Tables - Advanced Reporting Display Options